
2024 Presidential Election
Despite the state's Governor serving as the Vice Presidential nominee, Minnesota saw a notable shift to the right. The Democratic ticket won the presidential campaign with a margin of 4.2% in 2024 compared to 7.1% in 2020. Four key counties flipped from blue to red, signaling changing voter dynamics and underscoring the importance of localized campaign strategies.
Minnesota Democrats gained big in 2020’s high-turnout surge, but in 2024 they lost votes even as registration hit a record high. In our new world of disparate realities and targeted communication, Democrats can no longer count on increased support from a growing electorate.
key MN insights
MN Counties shifted right together regardless of size or geography.
96% of Minnesota counties shifted right in the 2024 Presidential election, regardless of size, historic DFL support, or geography.
Counties sized by total registered voter count.

Image 1

Image 2
Graphic 1 shows DFL margin by County, with counties grouped by size and in a wide range from a +40% to a -56%.
Graphic 2 shows the change in DFL margin in 2024, and here we see a much smaller range of under ten percentage points and with counties grouped regardless of size. Only Lincoln, Lake, and Cook saw an increase in DFL support.
There is no "rural voter" pulling MN or Winona to the right.
Geography did not protect the DFL as both urban and rural counties saw declines in DFL support.
Four Counties flipped in MN in 2024 - all from Democrat to Republican. The GOP was also able to flip (29) counties in the U.S. Senator race and gain a college town by flipping LD 26A.
This graphic shows the change in DFL margin by county with Counties sized by total registered voter
Color scale
Blue = Growth in DFL Support
Pink - Red = Decline in DFL Support
The flipped counties represent 128K registered voters and critical success for the GOP in flipping a college town (Winona).


Here we see an overall decline in DFL support that is stronger in Greater and Southeast MN, but it is notable that the cities, with higher concentrations of votes, all saw declines while exceptional outliers of increases in support were seen far outside the cities.
This pattern is repeated in Winona County.
"Rural voter" Test Case: Winona County - Presidential Race
Democrats lost 400 votes while Republicans gained over 1,000.
Sorted by DFL Support
-
WINONA proper precincts dominate the list of Top 5 precincts for DFL Support (Image 1)
-
Note all of the Top 5 saw declines in DFL support.
-
-
Rural precincts dominate the list for lowest DFL support (Image 2)
-
Note the positive swing in ALTURA.
-


Image 1

Image 2
Sorted by Change in DFL Support
-
WINONA proper precincts dominate the list for the most decline in DFL Support (Image 3).
-
Precincts with increases in DFL support were primarily outside of WINONA proper - although the top precinct was WINONA 4-3 (Image 4).
-
Note the magnitude of losses (max 13%) is greater than gains (max 3%) for an overall decline.

Image 3

Image 4
Declines in DFL Support are concentrated in WINONA proper while increases in support are found in more rural precincts like STOCKTON, GOODVIEW P2B, and DRESBACH.
Winona County follows the same pattern as the state overall, with declines in the city and increases of support.
To keep Minnesota blue, the DFL needs to rebuild support in the city while seeking to understand and leverage what is working in rural counties/precincts.
Democrats carried all of the state-wide decline in votes in 2024 while Republicans gained votes and continued to increase margin.
2024 was a turnout challenge for Democrats only, as the 2020 spike of support dissolved amid turnout returning to 2016 levels.

The bars show turnout - we see turnout returning to 2016 levels after a bump in 2020.
The line shows DFL margin - we see that this spiked in 2020 to 7% and then declines in 2024 to 4%.

Democrats carried all of the state-wide decline in votes in 2024 while Republicans gained votes.

Another way to see the vote distribution
Here we see the breakdown of total votes by party by year
Republicans are gaining steadily in MN since 2016.
Independent party support shrank significantly since 2016 with an uptick in 2024.
Democrats saw a decline in support following a spike.

Breaking down by County, we do see increases in DFL support
(3) Congressional Districts (CD) that saw increases in DFL votes - CD's 1, 6, and 8.
-
CD1 sees a 3K increase in DFL votes - offset by an 11K increase for Republicans
-
CD6 is the outlier as the only County with a larger increase for Democrats than Republicans
-
CD8 saw a 14K increase in DFL votes - offset by a 17K increase for Republicans

Democrats lost 60K votes while Republicans gained 35K.
Top 5 Counties by Total Registered Voter

Bottom 5 Counties by Total Registered Voter
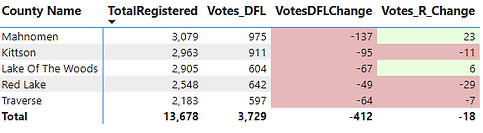
The Top 5 Counties by Total Registered Voter represented 85% of the decline in DFL votes.
"Turnout Hypothesis" Test Case: Winona County - Presidential Race
Democrats lost 400 votes while Republicans gained over 1,000.
Question: Where were DFL votes lost in Winona County?
Answer: Disproportionately in WINONA precincts.
This graphic shows the change in DFL and Republican vote totals by precinct.
We can use the slider on the left to zoom in,
shown below

Zooming in on positive vote changes only, we see a strong outperformance by Republicans with DFL votes only positive in four precincts - split evenly between WINONA proper and Goodview/Stockton.

Zooming in on negative vote changes only, we see a completely opposite picture dominated by the DFL with declines all along WINONA and the maximum loss of 109 votes - 25% of the votes lost - in WINONA 3-4.

WINONA proper precincts accounted for 61% of the decline in DFL votes despite accounting for only 49.5% of the ballots cast, meaning WINONA had a disproportionately negative impact on DFL support by the county.
Looking at total DFL/R vote counts and filtering to WINONA precincts we see it remains a solidly blue area but notice the blue line that indicates the change in DFL support shows all but two precincts with declining DFL support.

Change in DFL votes by Precinct
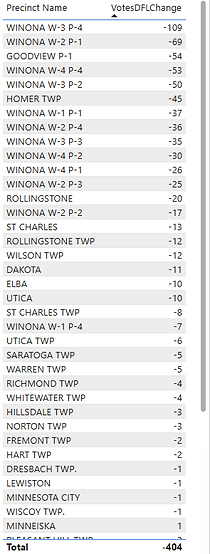
Looking at total DFL/R vote counts and filtering to NON- WINONA precincts we see complete opposite, with all precincts turning out for Republicans over Democrats

This graphic shows only precincts with increases in DFL support
WINONA 1-4 and WINONA 4-3 had increases in DFL support alongside a stack of rural precincts.

The data does points to a targeted loss within the DFL electorate.
-
Overall turnout remained relatively flat from its 2020 high. This was not a broad disengagement election. At the state and county level, Democrats carried all of the losses while Republicans gained.
-
Flipping traditional expectations, Democrats are losing in the City and with young voters.
-
Young people are engaged and voting. But they are not necessarily aligned with Democrats.
-
A smart strategy for Democrats would be educating the youngest voters on civics, media literacy, and anti-democratic rhetoric/misinformation.
-
College-aged voters are the most exposed to the internet and accompanying anti-democratic rhetoric.
-
College-aged voters are the least exposed to the Democrat-driven wins like unions and regulation.
-


This table shows each precinct's change in Republican and DFL votes, sorted by change in Republican votes.
WINONA 3-1 -
The WSU Precinct
The precinct with maximum growth in DFL votes (162) votes also saw the maximum increase in Republican votes (139).
Note WINONA precincts dominating Republican gains.
We can see the same table sorted by increase in DFL votes.
Note Republican gains are stronger and more consistent.
Note less WINONA and more rural precincts at the top of this list compared to above.
WINONA COUNTY
Sizing up Precincts
-
27,797 TOTAL VOTES PRESIDENTIAL 2024
-
49 PRECINCTS
-
PRECINCT VOTE MAX = 2,198 (ST CHARLES
-
PRECINCT VOTES MIN = 33 (MINNEISKA)
Total Votes
By Precinct
Descending

Total Votes
By Precinct
Descending

WINONA COUNTY
Top & Bottom Precincts - Votes Total, Votes R/DFL, & Change in Votes R/DFL
Now that we have an idea of scale - where are precincts moving away/to the DFL?
TOP 5 PRECINCTS FOR DFL VOTES

The DFL sees and increases and declines of support in their top vote-share precincts for an overall decline.
TOP 5 PRECINCTS FOR REPUBLICAN VOTES

For the Republican Top 5 we see only one decline - in GOODVIEW P-1 (shout-out!) and an overall increase as expected (compare to DFL declining in overall votes even in their Top 5).
BOTTOM 5 PRECINCTS FOR DFL VOTES

The DFL's Bottom 5 are as expected in small precincts combined with relatively sizeable losses of support in ELBA and UTICA.
BOTTOM 5 PRECINCTS FOR REPUBLICAN VOTES

Republicans' Bottom 5 had a net loss of only six votes - 4X the size of DFL's net loss in their Bottom 5.
WHERE PARTY LOST ONLY - REPUBLICANS
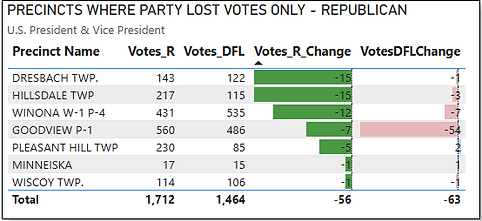
Republicans lost only (56) votes in the precincts that saw declines in Republican votes. Not a lot of WINONA or large precincts here.
Note that we also see declines in DFL votes, so it does not appear to be a shift but rejection of both.

WHERE PARTY LOST ONLY - DFL
Pulling the same list for the DFL we can see a much larger overall decline of (727), a much longer list of precincts with declines in total DFL votes, and we see a lot of WINONA precincts dominating the list.
At the precinct level, the above pattern is even more explicit when we isolate precincts where parties lost votes:
-
Republican losses are negligible—just 56 votes, limited and diffuse. There is no evidence of systemic Republican erosion.
-
In contrast, the DFL saw a -727 vote decline, heavily concentrated in Winona’s highest-density precincts—the exact areas that determine electoral outcomes.
-
This is a composition failure within the Democratic electorate—whether through non-participation, drop-off, or ballot rejection—but critically, it is one-sided.
-
The implication is unavoidable: the outcome was not decided by Republicans gaining ground—it was decided by Democrats losing it, in the precincts that matter most.
-
The opportunity in 2026 is data-driven leverage
-
Canvassing WINONA-proper precincts that flipped the County in Presidential and MN House races.
-
The DFL is losing where support is assumed.
-
Density of doors is a huge benefit.
-
Coordinated campaigning for all candidates could be powerful in minimizing over-contact rates.
-
-
WSU Precinct 3-1: College voters are engaged, and they are voting Republican.
-
Vote Dropoff
-
Rejected Ballots
-
Focus on civic education - the impact of MNHOUSE policies on college students
-
New legislative center at WSU
-
-
-
Strategic outreach by phone to non-WINONA precincts that are gaining in support
-
Strategy based on change in DFL support
-
Do this early in the election cycle to build a team of support that will then educate and engage voters locally
-
Collaborative effort that learns what's attracting voters.
-
-
Contact us now for your free report and strategy session.